This series of blogs that I have written for Carbon Credentials aims to illustrate how taking stock of your energy consumption and understanding the risk associated with a ‘business as usual’ approach presents a real opportunity to reduce costs; this first post discusses gas prices, the second discusses degree days, and the third combines both to attempt to show the cumulative impact.
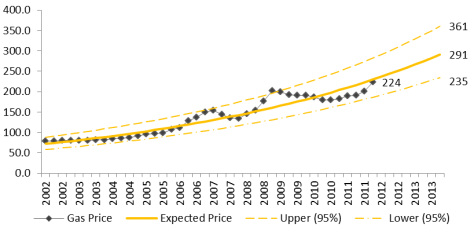
The cost of energy is increasing. So even if your consumption is flat over the next year your energy bill will increase – but by how much? Government releases fuel price data quarterly and analysing the past trends can offer some insight into the future. The key is not to try and forecast too far. I have used regression analysis to estimate what the gas prices might be at the end of 2013. The Figure shows the relative change in domestic gas prices from 2002 until 2012 – prices are based on 1987 data, i.e. 1987 =100, which means that the relative cost of gas was cheaper in 2002 than it was in 1987.
The line labelled Expected Price is the ‘line of best’ for the data which has been forecast forward to the end of 2013 and shows an increasing trend (the index increases from 224 to 291) equivalent to an uplift of 30% inclusive of inflation. The other two curves represent the upper and lower limits of the model and can be interpreted in the following way: we can be 95% sure that the gas price index will be between 235 (a 5% uplift) and 361 (a 65% uplift). The interval is wide for two reasons, firstly that the gas price is volatile (shown by the peaks and troughs) and secondly, because the model, i.e. the line of best fit, is an exponential.
So am I just scaremongering? Not intentionally. My message is to look at the trend rather than the predicted values themselves and the trend for the last 10 years has been an increase in the price of gas. The index almost doubled from Q1 2002 to Q1 2008 and if it continues we could expect see it double again by Q1 2014.
Using an energy management system to get all your energy data into one place and facilitate benchmarking typically reduces the energy spend by around 5%, coupled with proactive engagement and measuring and monitoring strategies this could get to 10%. If the cost of energy is following an exponential trend then so too will the savings. Now I might be wrong about the trend, but can you afford to wait to see if I’m right?

 RSS Feed
